- Sun 03 March 2013
- 11 min read
- Debugging
- #gdb, #debugging, #cpp, #gcc
The GNU Debugger[1] is my favorite debugging tool and I personally think it’s essential for any *nix developer to know how to use it properly if you’re working with C/C++, D, Go, Obj-C, Fortran, Pascal, Modula-2 or Ada[2].
This is the second part of Unleashing the power of GDB. It is recommended reading the first part before proceeding. First section is about integrating GDB with Emacs, the second is about how to debug errors as they occur with common cases and the last section is about debugging without any debug symbols.
1. Integration with Emacs
GDB is taken to the next level when used together with my favorite editor Emacs[3] because it adds autocompletion of commands and arguments, and easy stepping in the command history - saves a lot of time. But perhaps even more important: If the program is compiled with debugging symbols it will also load and show the source code. Thus hitting breakpoints and stepping through the program will show the placement in the source code as well.
Let’s take the first snippet of code from the previous article:
#include <string>
#include <iostream>
using namespace std;

void func2(const string &str) {
  cout << "func2 says: " << str << endl;
}

void func1(int i) {
  string str(i, "$");
  func2(str);
}

int main(int argc, char **argv) {
  for (int i = 1; i <= 3; i++) {
    func1(i * 5);
  }
  return 0;
}
And compile it:
g++ -g -o test test.cpp
Open Emacs if you didn’t use it already to save the file. Hit M-x gdb <RET> to fire up the GDB mode. I recommend using the most recent GDB (7.5+) together with Emacs because it works better.
Give the following arguments to the GDB mode:
gdb -i=mi /path/to/program
The current working directory is the directory of the file being edited when going into GDB mode. So if editing /tmp/test.cpp then gdb -i=mi test will run /tmp/test.
Note that the above assumed Emacs version 24. If you are running previous versions you can use this instead:
gdb --annotate=3 /path/to/program
Thanks to Paw for pointing that out.
Let’s break at the main function:
(gdb) b main
(gdb) r
If you see the following error while running on OSX:
Starting program: /x/y/foo
Unable to find Mach task port for process-id 76352: (os/kern) failure (0x5).
 (please check gdb is codesigned - see taskgated(8))
Then you might want to follow these instructions to give GDB the necessary rights for debugging (you have to sign the GDB executable).
This is how it looks with my Emacs configuration: 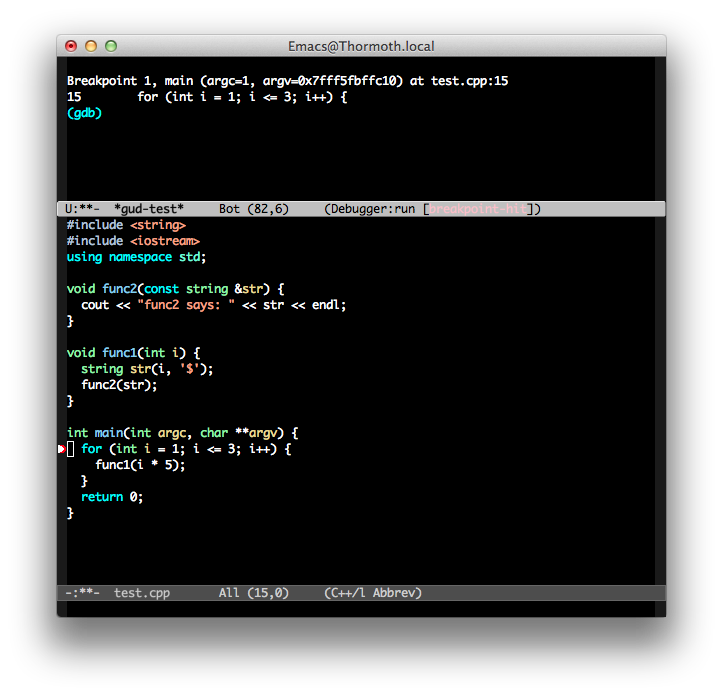
2. Inspecting actual bugs
Now I’ll show some typical programming bugs and how to spot and fix them using GDB. Suppose you have written a program but you get the following error when running it:
./prog1
segmentation fault  ./prog1
Note that the error might be displayed in various of ways. A segmentation fault happens but you will be wondering what caused it so we fire up GDB:
gdb ./prog1
Reading symbols for shared libraries ... done
(gdb) r
Starting program: /private/tmp/prog1
Reading symbols for shared libraries ++............................. done

Program received signal EXC_BAD_ACCESS, Could not access memory.
Reason: KERN_INVALID_ADDRESS at address: 0x0000000000000000
0x0000000100000f27 in main (argc=1, argv=0x7fff5fbffa78) at prog1.cpp:3
3     *ptr = 1;
(gdb) p ptr
$1 = (int *) 0x0
First it is observed that we are denied access to some memory at address 0x0..0 and that it’s the line *ptr = 1 (prog1.cpp:3) that caused it. So we already know from the error message that ptr must then be a null-pointer but we double-check by inspecting it with p ptr.
Another example might be the following:
./prog2
prog2(12673) malloc: *** error for object 0x7ffd08c03930: pointer being freed was not allocated
*** set a breakpoint in malloc_error_break to debug
abort      ./prog2
From the error message we now know that some unallocated memory was freed. It also gives a tip on where to start debugging, so let’s do just that:
gdb ./prog2
Reading symbols for shared libraries ... done
(gdb) b malloc_error_break
Function "malloc_error_break" not defined.
Make breakpoint pending on future shared library load? (y or [n]) y
Breakpoint 1 (malloc_error_break) pending.
(gdb) r
Starting program: /private/tmp/prog2
Reading symbols for shared libraries ++............................. done
Breakpoint 1 at 0x7fff9439b558
Pending breakpoint 1 - "malloc_error_break" resolved
prog2(12693) malloc: *** error for object 0x100103920: pointer being freed was not allocated
*** set a breakpoint in malloc_error_break to debug

Breakpoint 1, 0x00007fff9439b558 in malloc_error_break ()
(gdb) bt
#0  0x00007fff9439b558 in malloc_error_break ()
#1  0x00007fff9439c912 in free ()
#2  0x0000000100000f03 in main (argc=1, argv=0x7fff5fbffa78) at prog2.cpp:4
(gdb) f 2
#2  0x0000000100000f03 in main (argc=1, argv=0x7fff5fbffa78) at prog2.cpp:4
4     delete[] txt;
(gdb) l
1   int main(int argc, char **argv) {
2     char *txt = new char[128];
3     delete[] txt;
4     delete[] txt;
5     return 0;
6   }
So we set a pending breakpoint, start the program, find the frame and observe the double delete[] on line 3 and 4.
A third possibility is a floating point exception:
./prog3
floating point exception  ./prog3
Using GDB we immediately see the problem:
gdb ./prog3
Reading symbols for shared libraries ... done
(gdb) r
Starting program: /private/tmp/prog3
Reading symbols for shared libraries ++............................. done

Program received signal EXC_ARITHMETIC, Arithmetic exception.
0x0000000100000f38 in main (argc=1, argv=0x7fff5fbffa78) at prog3.cpp:3
3     return a / 0;
Which in this case is a division-by-zero error. Pay attention to the warnings your compiler issues to avoid these things. It might have looked like this:
prog3.cpp:3: warning: division by zero in ‘a / 0’
Note that these are just examples of runtime errors. A lot more exist that I have not covered here.
3. Debugging with no debugging symbols
Sometimes the program you are debugging has no symbol table and you still have to locate the problem. It might be that you are debugging a third party binary so you don’t have access to the source code. This section will be a bit advanced.
Let’s start with the first problematic program from last section: prog1. This is what GDB tells us with no debug symbols:
gdb ./prog1
Reading symbols for shared libraries ... done
(gdb) r
Starting program: /private/tmp/prog1
Reading symbols for shared libraries ++............................. done

Program received signal EXC_BAD_ACCESS, Could not access memory.
Reason: KERN_INVALID_ADDRESS at address: 0x0000000000000000
0x0000000100000f27 in main ()
Unfortunately we cannot inspect the source code but instead we can inspect the machine code by disassembling a section of memory into symbolic language:
(gdb) disas
Dump of assembler code for function main:
0x0000000100000f10 <main+0>:    push   %rbp
0x0000000100000f11 <main+1>:    mov    %rsp,%rbp
0x0000000100000f14 <main+4>:    mov    %edi,-0x4(%rbp)
0x0000000100000f17 <main+7>:    mov    %rsi,-0x10(%rbp)
0x0000000100000f1b <main+11>:   movq   $0x0,-0x20(%rbp)
0x0000000100000f23 <main+19>:   mov    -0x20(%rbp),%rax
0x0000000100000f27 <main+23>:   movl   $0x1,(%rax)
0x0000000100000f2d <main+29>:   movl   $0x0,-0x18(%rbp)
0x0000000100000f34 <main+36>:   mov    -0x18(%rbp),%eax
0x0000000100000f37 <main+39>:   mov    %eax,-0x14(%rbp)
0x0000000100000f3a <main+42>:   mov    -0x14(%rbp),%eax
0x0000000100000f3d <main+45>:   pop    %rbp
0x0000000100000f3e <main+46>:   retq
End of assembler dump.
Let us focus around the reported address 0x0000000100000f27:
(gdb) disas 0x0000000100000f1b 0x0000000100000f2d
Dump of assembler code from 0x100000f1b to 0x100000f2d:
0x0000000100000f1b <main+11>:   movq   $0x0,-0x20(%rbp)
0x0000000100000f23 <main+19>:   mov    -0x20(%rbp),%rax
0x0000000100000f27 <main+23>:   movl   $0x1,(%rax)
End of assembler dump.
````

On the third line the pointer is accessed and `1` is attempted saved at the location. So this information can be given to the third party. However, we actually know the source code so I'll show the parallels:

```shell
movq   $0x0,-0x20(%rbp)            int *ptr = 0;
mov    -0x20(%rbp),%rax            // Put addr 0 in %rax
movl   $0x1,(%rax)                 *ptr = 1;
On the first line 0 is saved at -0x20(%rbp), line two moves the address (0) to %rax and the third line tries to dereference the null-pointer and assign 1 to it.
Let us try to do the same thing for prog2:
gdb ./prog2
Reading symbols for shared libraries ... done
(gdb) b malloc_error_break
Function "malloc_error_break" not defined.
Make breakpoint pending on future shared library load? (y or [n]) y
Breakpoint 1 (malloc_error_break) pending.
(gdb) r
Starting program: /private/tmp/prog2
Reading symbols for shared libraries ++............................. done
Breakpoint 1 at 0x7fff9439b558
Pending breakpoint 1 - "malloc_error_break" resolved
prog2(15026) malloc: *** error for object 0x100103920: pointer being freed was not allocated
*** set a breakpoint in malloc_error_break to debug

Breakpoint 1, 0x00007fff9439b558 in malloc_error_break ()
(gdb) bt
#0  0x00007fff9439b558 in malloc_error_break ()
#1  0x00007fff9439c912 in free ()
#2  0x0000000100000f03 in main ()
The exception arises on address 0x0000000100000f03, so again we have to disassemble to make sense of it:
(gdb) disas
Dump of assembler code for function main:
0x0000000100000eb0 <main+0>:    push   %rbp
0x0000000100000eb1 <main+1>:    mov    %rsp,%rbp
0x0000000100000eb4 <main+4>:    sub    $0x20,%rsp
0x0000000100000eb8 <main+8>:    mov    %edi,%eax
0x0000000100000eba <main+10>:   mov    %eax,-0x4(%rbp)
0x0000000100000ebd <main+13>:   mov    %rsi,-0x10(%rbp)
0x0000000100000ec1 <main+17>:   mov    $0x80,%rax
0x0000000100000ecb <main+27>:   mov    %rax,%rdi
0x0000000100000ece <main+30>:   callq  0x100000f20 <dyld_stub__Znam>
0x0000000100000ed3 <main+35>:   mov    %rax,-0x20(%rbp)
0x0000000100000ed7 <main+39>:   mov    -0x20(%rbp),%rax
0x0000000100000edb <main+43>:   cmp    $0x0,%rax
0x0000000100000edf <main+47>:   je     0x100000eed <main+61>
0x0000000100000ee1 <main+49>:   mov    -0x20(%rbp),%rax
0x0000000100000ee5 <main+53>:   mov    %rax,%rdi
0x0000000100000ee8 <main+56>:   callq  0x100000f1a <dyld_stub__ZdaPv>
0x0000000100000eed <main+61>:   mov    -0x20(%rbp),%rax
0x0000000100000ef1 <main+65>:   cmp    $0x0,%rax
0x0000000100000ef5 <main+69>:   je     0x100000f03 <main+83>
0x0000000100000ef7 <main+71>:   mov    -0x20(%rbp),%rax
0x0000000100000efb <main+75>:   mov    %rax,%rdi
0x0000000100000efe <main+78>:   callq  0x100000f1a <dyld_stub__ZdaPv>
0x0000000100000f03 <main+83>:   movl   $0x0,-0x18(%rbp)
0x0000000100000f0a <main+90>:   mov    -0x18(%rbp),%eax
0x0000000100000f0d <main+93>:   mov    %eax,-0x14(%rbp)
0x0000000100000f10 <main+96>:   mov    -0x14(%rbp),%eax
0x0000000100000f13 <main+99>:   add    $0x20,%rsp
0x0000000100000f17 <main+103>:  pop    %rbp
0x0000000100000f18 <main+104>:  retq
End of assembler dump.
This is a large chunk but I will point out the important little details. The following line calls new[]:
0x0000000100000ece <main+30>: callq 0x100000f20 <dyld_stub__Znam>
The reason is that _Znam actually means operator new[](unsigned long). You can use the tool c++filt or this site to do demangle symbols.
And here are the double deletions:
0x0000000100000ee8 <main+56>:   callq  0x100000f1a <dyld_stub__ZdaPv>
0x0000000100000efe <main+78>:   callq  0x100000f1a <dyld_stub__ZdaPv>
_ZdaPv means operator delete[](void*). In both cases they are passed the same address by the following instructions:
0x0000000100000ee1 <main+49>:   mov    -0x20(%rbp),%rax
0x0000000100000ee5 <main+53>:   mov    %rax,%rdi
And here as well:
0x0000000100000ef7 <main+71>:   mov    -0x20(%rbp),%rax
0x0000000100000efb <main+75>:   mov    %rax,%rdi
The third program with the floating-point exception is debugged in the following way without symbols:
gdb ./prog3
Reading symbols for shared libraries ... done
(gdb) r
Starting program: /private/tmp/prog3
Reading symbols for shared libraries ++............................. done

Program received signal EXC_ARITHMETIC, Arithmetic exception.
0x0000000100000f38 in main ()
Once again it is necessary to disassemble:
(gdb) disas
Dump of assembler code for function main:
0x0000000100000f20 <main+0>:    push   %rbp
0x0000000100000f21 <main+1>:    mov    %rsp,%rbp
0x0000000100000f24 <main+4>:    mov    %edi,-0x4(%rbp)
0x0000000100000f27 <main+7>:    mov    %rsi,-0x10(%rbp)
0x0000000100000f2b <main+11>:   movl   $0xff,-0x1c(%rbp)
0x0000000100000f32 <main+18>:   mov    -0x1c(%rbp),%eax
0x0000000100000f35 <main+21>:   xor    %ecx,%ecx
0x0000000100000f37 <main+23>:   cltd
0x0000000100000f38 <main+24>:   idiv   %ecx
0x0000000100000f3a <main+26>:   mov    %eax,-0x18(%rbp)
0x0000000100000f3d <main+29>:   mov    %eax,-0x14(%rbp)
0x0000000100000f40 <main+32>:   mov    -0x14(%rbp),%eax
0x0000000100000f43 <main+35>:   pop    %rbp
0x0000000100000f44 <main+36>:   retq
End of assembler dump.
The interesting lines are these with the exception happening on the last line:
0x0000000100000f2b <main+11>:   movl   $0xff,-0x1c(%rbp)
0x0000000100000f32 <main+18>:   mov    -0x1c(%rbp),%eax
0x0000000100000f35 <main+21>:   xor    %ecx,%ecx
0x0000000100000f37 <main+23>:   cltd
0x0000000100000f38 <main+24>:   idiv   %ecx
This basically does the operation 0xFF / 0. 0xFF is saved to -0x1c(%rbp) and moved to %eax, then 0 is “created” by doing an XOR on %ecx with itself (recall that XOR on two equal operands always yields 0) and storing in %ecx, cltd converts signed long word %eax to a double word in %edx:%eax and finally idiv does the signed division.
Stay tuned for more.