- Sat 02 February 2013
- 2 min read
- Profiling
- #profiling, #cpp, #xcode
Profiling binaries is essential in any serious development process. Unfortunately not very many good profilers exist out there. I usually employ Valgrind to detect memory leaks and the front-end KCachegrind to inspect call stacks. But KCachegrind requires both X11 and KDE3 libs which I want to avoid. However, last week I discovered Instruments.app that comes with Xcode. It’s a great profiler with lots of different modes, like detecting memory leaks, tracking heap allocations, detection of “zombie” objects, time-based profiling, performance monitor counter (PMC) based sampling, event-based sampling, file activity, sudden termination analysis and much more. But Instruments.app is not good at finding uninitialized variables like Valgrind is among other things - so this is not a direct substitution!
The app is located here:
/Applications/Xcode.app/Contents/Applications/Instruments.app
Let’s write a little program with a memory leak that we want the program to detect for us.
Save the following code to a file named “memleak.cpp”:
#include <unistd.h>

int main(int argc, char **argv) {
  for (int i = 0; i < 10; i++) {
    char *test = new char[1024];
    sleep(1);
  }
  return 0;
}
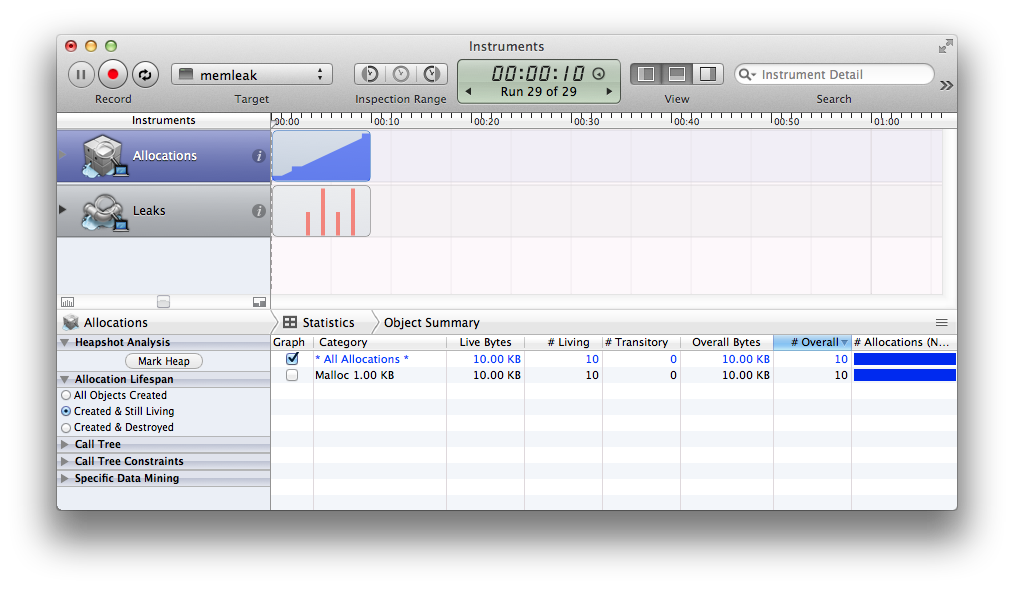
Compile the program and run Instruments.app. When it starts select the “Leaks” template in the “Mac OS X” section and click “Choose”. A new window opens up showing two instruments; one for allocations and one for explicit memory leaks. Before one can record anything the program to profile has to be chosen in the “Choose Target” drop-down menu. Click “Record” and wait for the program to terminate (after 10 seconds) and you’ll have the following results:
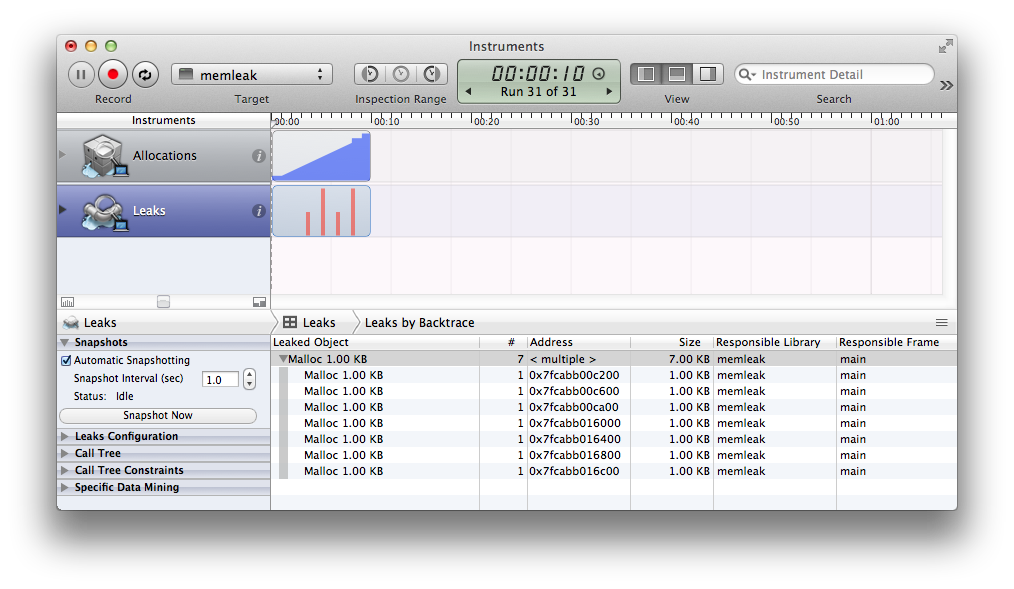
Clicking the “Leaks” instrument you will see:
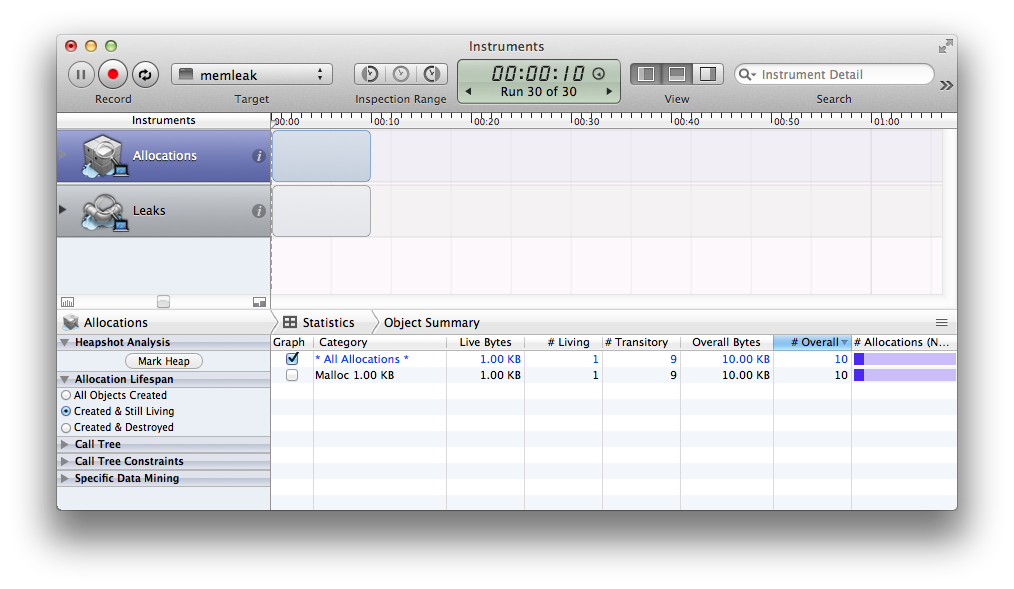
Just to show the difference try inserting delete[] test; after line 5 in the code, recompile and re-record the analysis. You’ll see the following:
Sometimes it’s necessary and insightful to gaze upon the call stacks:
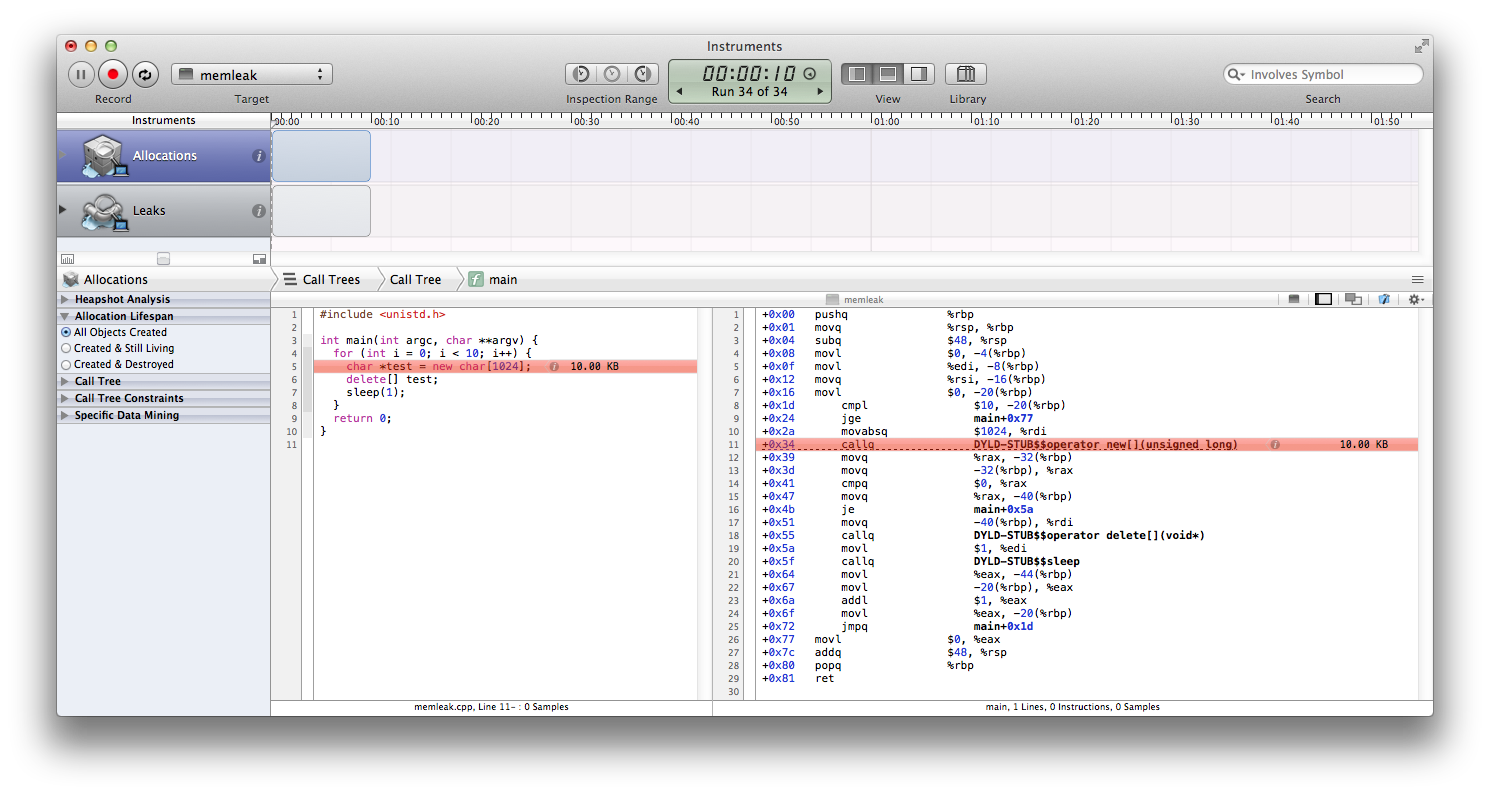
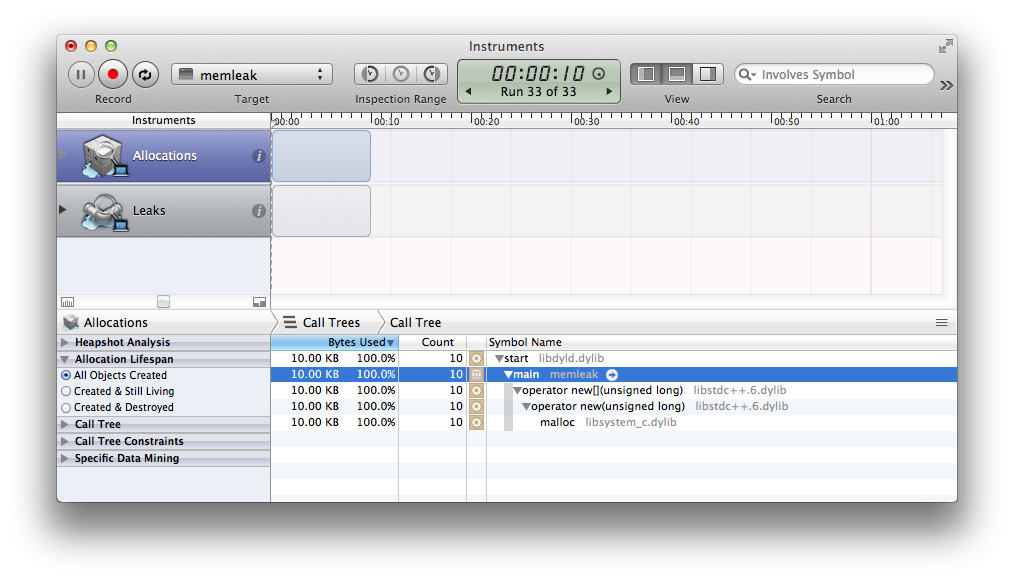 Furthermore, any system libraries and missing symbols can be hidden in the “Call Tree” sidebar for convenience. If the program was compiled with debugging symbols (use
 -g with GCC or Clang, for instance) the source code along with the machine code can be shown by double-clicking an entry:
In any case, I will try using this profiler more at work and see if I find more interesting features to share.